Two days ago we published Folding the Graph, about the typed connections our agents write into the Knowledge Bank and the retrieval change that folds connected results into one slot and hands the agent the next hop. The lab numbers were good and the production numbers were honest. But a sentence near the end of that post kept bothering us: a graph you cannot see is a graph you cannot argue about. The same is true one level up. We could see the graph. We still could not see what an agent did with it. A query log shows what retrieval returned; it does not show which result the agent read, which pointer it followed, whether it walked, or where the sentence it finally wrote came from. So we built a way to watch, and then we watched. This post is about the tool and about the first four real runs, which taught us more than the lab did.
What We Built
The Knowledge Bank Explorer grew an Ask tab. You type a question, pick a model, and a small model (gpt-6-luna by default, the cheapest thing in our registry) works the question against that one bank the way an agent does. It has three tools and nothing else:
- search the bank, with folding on, which returns ranked entries and, for each, the typed pointers to what was folded into it and what sits one hop away, with the note that says why;
- read one entry in full, including its connections and their notes;
- walk the graph from one entry out to one, two or three hops, returning every entry in that neighbourhood and the typed edges between them.
The design choice that makes it watchable is where the tools run. The bank service runs one model turn per request: it sends the model the question and the tool definitions, gets back what the model said and which tools it wants called, and returns that to the browser. The browser runs the tools itself, against the same search, entry and graph routes the Explorer already uses, paints the results onto the 3D scene from the Graph tab, and posts the outputs back for the next turn. Nothing happens inside a loop you cannot see. That is also why a Step mode exists: with auto-run off, the tab waits for you to press Next step after each round of tools, which is exactly the “here is a search, here is what it found, now what” pace a person reviews at.
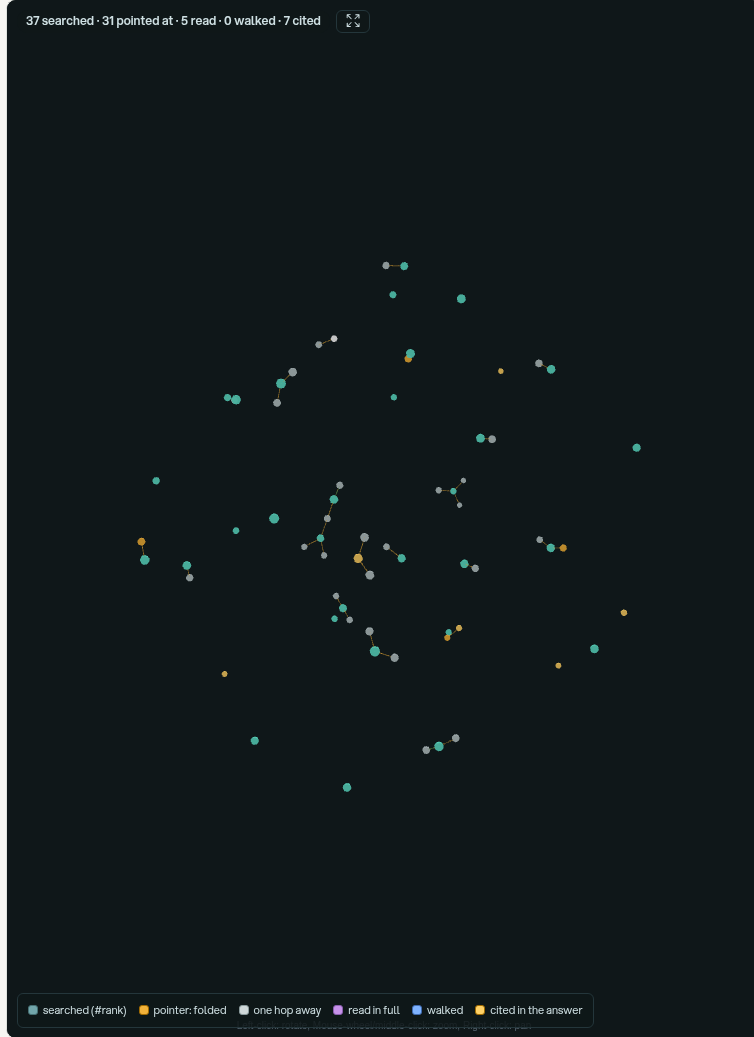
Every entry the model touches gets a colour on the graph by the role it played: teal for a search hit with its rank, amber for an entry folded into a result, grey for a one-hop neighbour the search did not fetch, purple for an entry the model read in full, blue for one it walked to, and gold for an entry the final answer cites. The rest of the bank shrinks to dots. Beside the graph runs the trail: the model's own sentence before each action, the tool call with its arguments, what came back, and at the end the answer with its citations as chips you can click to fly to the entry.
All of it is recorded. Each run is a row with a small state machine (running to answered, step limit, failed or abandoned) and each model turn is a row holding the request as sent, the raw response, the parsed thinking and tool calls, token usage and duration. A past run can be replayed from those rows alone, and the same loop is available to scripts through the SDK, so a test harness can watch too. The three end-to-end runs we used to verify the feature cost under a cent together.
Four Real Questions
The feature shipped to production on the evening of October 21. The next morning the owner of the platform asked it four questions against our own engineering bank, which held 8,884 entries that day and has answered 56,000 queries from agents. We pulled the audit rows afterwards and read them. Here is the shape of what happened.
| Question | Steps | Searches | Reads | Walks | Citations | Tokens in / out |
|---|---|---|---|---|---|---|
| Give me a detailed breakdown of the KB system | 4 | 2 | 4 | 0 | 4 | 22,009 / 1,257 |
| What is the client onboarding process | 2 | 1 | 0 | 0 | 2 | 4,521 / 263 |
| Provide a complete summary of how we handle Claude sessions (first try, 6 of 12 steps) | 6 | 3 | 8 | 0 | 8 | 54,038 / 1,797 |
| Same question again, thinking set higher | 8 | 4 | 7 | 0 | 7 | 87,386 / 1,983 |
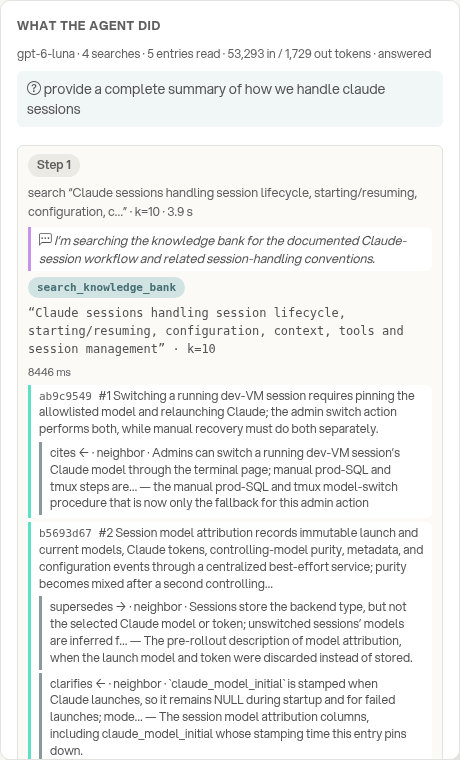
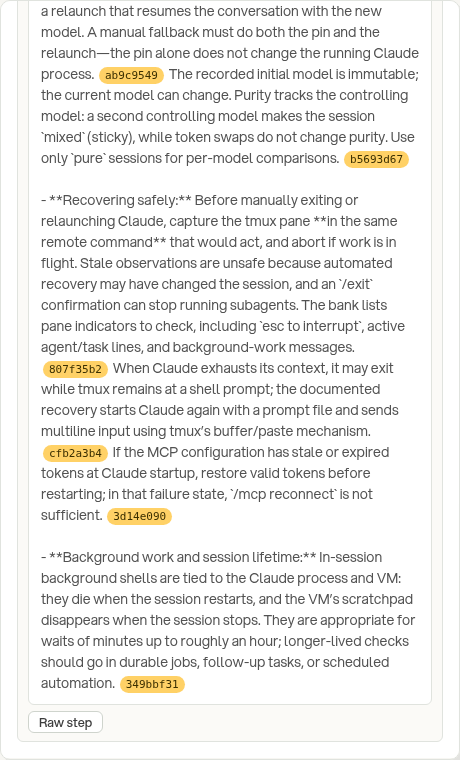
The last run is the one worth reading in full. The question is broad on purpose, and the bank has no single entry that answers it; what it has is a few dozen entries about dev-VM sessions, credential injection, recovery, model attribution and transcripts, written by different agents over a year and connected by the edges those agents declared. The trail, lightly shortened, with the model's own words in italics:
The answer itself was good. It separated a session's platform identity from the identity the model reports, named the recovery orchestrator and said when to use it, warned that a resumed session can sit idle until it gets real input, and explained the model switch for a running session versus a new dispatch. Every one of those sentences carries the id of the entry it came from, and every id resolves. The closing admission, that the bank has no single consolidated description, is correct and is the kind of sentence we want a small model to write rather than invent.
We ran the same question once more while writing this, so that the pictures below are of a live run. It went the same way: four searches, five reads, no walk, seven citations, 53,000 tokens in.
What Watching Showed
1. It never walked
Four runs, ten searches, nineteen reads, zero walks. The walk tool was there, described, and the system prompt said to use it when connections matter. The model never judged that they did. On reflection we think it was right not to: a folded search already hands it the one-hop neighbourhood of every result with a reason attached, so the marginal value of walking from a hit it has already read is small. When we ask it to walk explicitly it walks, and the picture is pretty. Left to itself, it does not, and the headline of the post we had half-written in our heads, the one about an agent striding across the graph, did not survive contact with the audit table.
2. It read instead of hopping, and the one hop it took went into the answer
Of nineteen entries read in full, seventeen were search hits the model had already seen a summary of. Two were not: in both of the long runs, the model read e7938a75, the entry describing the recovery orchestrator, which no search returned as a result. It arrived as a clarifies pointer folded under the entry about synthetic resume messages. The model saw the pointer, read the target in full, and cited it in the answer both times. That is the hop from the last post, taken by a small model that had not been told to take it, and it is the direct answer to the first question the owner asked after his runs: did it cite anything it had to go and get? Yes, one entry per run, by pointer rather than by walk, and that entry was the single most useful one in the answer.
The honest reading of the rest is the one we gave in the last post: pointers are consumed mostly as text. The model saw dozens of them, read their one-sentence summaries, and let them shape which hits it read in full. It followed one. That was enough to matter.
What the Owner Said
Our owner ran it before we did, and his notes from that session are the roadmap, so here they are more or less verbatim. He wanted to see whether the answer cited entries the model had to walk to rather than ones a search returned directly; a citation chip today is just an id, and the node colour hides its origin because “cited” outranks every other role. He thought the graph visual “doesn't seem that good”, and he is right that a trail of a few dozen lit nodes inside eight thousand dimmed ones reads as scatter unless the camera is doing the work. And he wanted every single tool call broken down in more detail: the arguments as sent, every row that came back, the pointers and notes on each, the duration and the tokens.
All three are the same ask from different sides: show the provenance. The trail model already accumulates every role an entry played; it only emits the winning one. The next version carries all of them, so a chip can say cited · reached by pointer at step 1, read at step 3, the per-call panel shows the whole output instead of a preview, and a multi-role node draws its origin colour with a cited ring over it instead of being overwritten.
Why Watch at All
Most evaluation of retrieval for agents reports a number: recall at k, answer accuracy on a benchmark, the hop rate from our own lab. Numbers are how you know a change helped on average. They are not how you find out that the model reads rather than walks, or that one pointer in a hundred is the one it takes and that one goes into the answer. For that you need to see a single run, end to end, with the bytes that were actually exchanged, and you need the person who owns the system to sit in front of it and say what is unclear.
The Ask tab is not the product. The product is the bank and the agents that use it. The tab is how we argue about them. It took a day to build on top of a graph layer that took a month, and in its first morning it changed what we are fixing next. We think that is the right order: make the behaviour visible first, then make it good, and keep the audit trail honest enough that the second step has something to stand on.
Try It Yourself
The Ask tab is open to anyone on a demo bank: Harborline Provisions, a fictional food distributor whose Knowledge Bank holds how the business runs, with the connections the facts have to each other. Pick one of the suggested questions or ask your own, and watch the model work it. Open the playground.
Want to see what your agents actually do with what you give them?
We run shared Knowledge Banks for engineering teams and for the businesses they serve: embeddings, typed connections written by the agents themselves, retrieval that folds, and now a window where you can watch a model work a question against your bank one step at a time, with every step recorded.
Get in Touch